Over commitment in its simplest term means allocating more resources to virtual workloads then what is available at physical level. Most common resources that are over committed are memory and cpu.
A simple example of over commitment can be running 3 VM each with 4 GB RAM on an Esxi host which has only 8 GB RAM. In this case we have allocated 12 GB RAM to all VM’s collectively but at physical level (Esxi host) we have only 8 GB RAM available.
It is a general belief by most novice VMware admins that allocating more resources to virtual machines means better performance. When I started working with VMware I also used to think in the same way.
It was the vSphere Optimize and Scale training, where I learned this is not true and how over commitment can badly affect VM performance.
In this post I am trying to demonstrate the negative affects of CPU over commitment.
Before diving into demonstration lets recall a few terms which will help understanding concepts more clearly.
- pCPU- Total physical CPU X Number of cores. In this example I have a host with 2 CPU and 2 cores and thus total of 4 pCPU.
- vCPU- CPU’s allocated to a Virtual Machine.
- Esxtop- Performance analysis utility, usually run from Esxi Console or SSH.
- %RDY- CPU Ready Time is the amount of time a virtual machine is ready to use CPU but was unable to schedule time because all physical CPU are busy.
- %CSTP- The percentage of time that the virtual machine is ready to execute commands but that it is waiting for the availability of physical CPU’s as the virtual machine is configured to use multiple vCPUs.
- %WAIT- It is the percentage of time the virtual machine was waiting for some VMkernel activity to complete (such as I/O) before it can continue.
- %IDLE- The percentage of time a world is in idle loop.
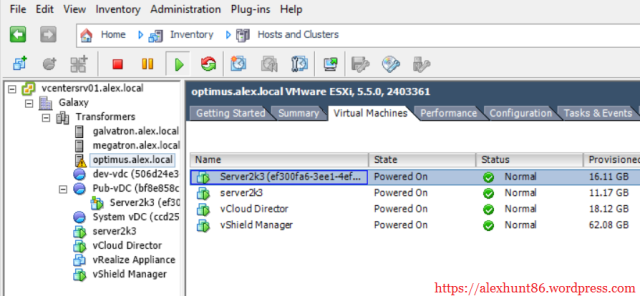
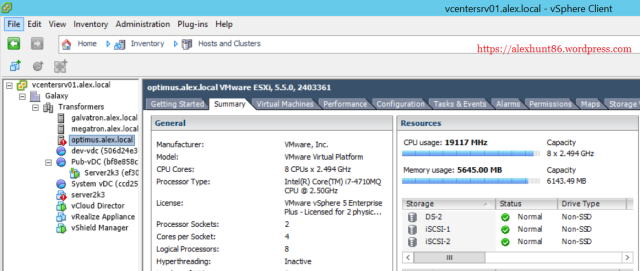
The host on which these VM are running has 6 GB of RAM and has 8 CPU X 2.4 GHz.
CPU allocation for the VM’s are as follows:
Server 2003-1: 1 vCPU
Server 2003-2: 1 vCPU
RHEL Server: 1 vCPU
vShield Manager: 2 vCPU
Lets begin with the demonstration:
1: Power on all VM’s

2: Run Esxtop

In general:
- %RDY (CPU Ready) should be low
- %CSTP should be 0.00
- %IDLE should be high – indicating high percentages of resources waiting for something to do
4: Change the number of cores per socket to 8 for both VM
Select 1 sockets and 8 cores per socket to make total vCPU=8


5: Power on the 2 VM and look at the esxtop stats again

Gees, look at the %RDY and %CSTP time.
- High %RDY value indicates that vCPUs are waiting for actual physical CPUs to schedule their threads.
- High %CSTP indicates that ESXi is asking the vCPUs to wait – A.K.A. co-stopping them for scheduling purposes.
For Linux VM there is one script available at GitHub
Note: Before running the cpuload.sh script make sure the Linux VM has ‘stress‘ and ‘cpulimit‘ rpm’s installed
Copy the code from GitHub and save it as cpuload.sh and run following commands:
# chmod +x cpuload.sh
# ./cpuload.sh [cpu load in percent] [duration in seconds]
For e.g to force cpu utilization to 75% for 50 seconds run the command as shown below:
# ./cpuload.sh 75 50
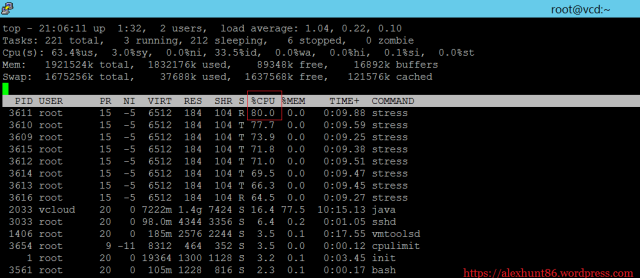
On running cpuload.sh on linux VM, if you fire top command you will see the cpu stats as below:

If we look at the esxtop stats, we will see something like as shown below:

Holy crap. Look at the jump in %RDY and %CSTP values
For Windows OS there is a nice utility called Load Storm. This utility can be downloaded from Here
Note: Load Storm requires dotnet framework 3.5 to be pre-installed.

To generate load on cpu adjust the Number of threads value and Approx core load per thread. Also you can choose the checkbox Generate load for if you wish to keep cpu busy for more than default one minute.
On generating 100% workload on cpu, the windows reported CPU utilization as 100%

Lets see the esxtop stats

As expected you can see the rise in value for %RDY and %CSTP for Windows VM
If we check the Esxi host CPU stats in GUI we can see CPU is almost maxed out

Also the performance chart will show a sudden rise in CPU utilization when we have run the cpu load script on both windows and linux vm together.

In my case GUI was reporting almost full utilization of physical cpu. But in production environment it is very common to see Esxi host utilization somewhere near 50-60% but still VM’s are reporting high %RDY and %CSTP values in Esxtop.
High %RDY and high %CSTP indicate an over-allocation of CPU resources – i.e. too many vCPU for the job at hand
Now I am going to power off the RHEL and Windows VM and set the vCPU to 2 and re-run the cpu load scripts to see if there is any difference in %RDY and %CSTP values.
I choosed to run 4 threads on 2 vCPU in windows VM.


After changing the cpu count, esxtop has following readings

You can see there is significant drop in %RDY and %CSTP values for both VM’s.
Conclusion
Assigning fewer vCPUs to a VM than it has threads is more efficient than assigning more vCPUs; but if we assign the exact number of vCPUs as threads, we risk increasing %RDY and %CSTP if we over commit the total number of vCPUs in the environment.